Step 1: Automatic search
Again, we used our global butterfly checklist (http://papilionoidea.myspecies.info/content/checklist-checklists) to do an automatic search of information in:
- Global Biodiversity Information Facility, GBIF
- Lepidoptera and some other life forms
- African Butterfly Database
Step 2: Summary file
Combing these sources we got names of region, country, province or localities, or geographic coordinates (latitude or longitude) where the species have been recorded, and built the following table:
|
Column name |
Description |
Example of content |
|
val |
Scientific name from the checklist |
|
|
rgn |
Region where the species have been recorded |
Amazonia, Tibet |
|
cntr |
Country where the species have been recorded |
Brazil, CO, |
|
prv |
Province where the species have been recorded |
Oaxaca, Miranda, Ohio |
|
locality |
Country where the species have been recorded |
Cerrado, 500 m from Matambu river |
|
lat |
Latitud in geographical coordinates |
|
|
long |
Longitude in geographical coordinates |
Step 3: Polygon information
Then, we search the polygon corresponding to each region, country, province or locality using different sources like:
We built other table with this information:
|
Column name |
Description |
Example of content |
|
loc |
Region, country, province or locality name |
Sahara, China, Choco, ZA, VE, BZ |
|
source |
Data source |
DIVA-GIS, |
|
poly |
Name of the polygon layer |
Next, we matched both tables to assign the corresponding polygon to each species. We estimated distribution range size as the number of cells within the corresponding polygon. We established two different approaches to define the polygon:
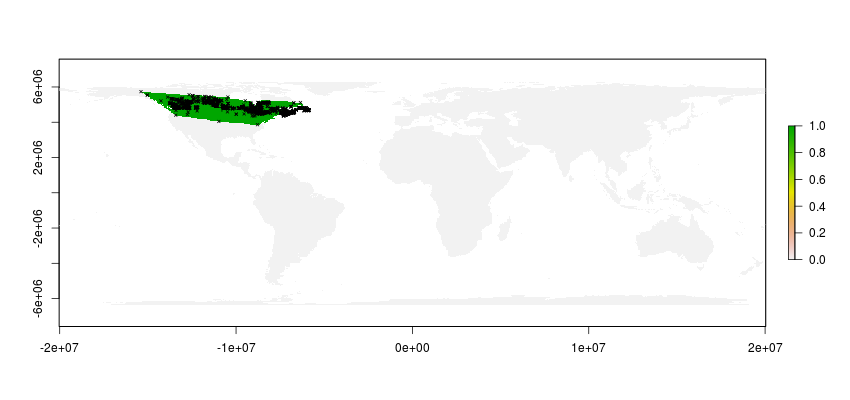
- For species with only general information at region, country or provincial level, we took the centroids form the described locality and then we applied a “convex hull” method to calculate the polygon. See example:

- For species with georrreferenced points we applied a “convex hull” method to calculate the polygon. See example:

3. For species with both information at region or country level, and also with georrreferenced points, we combine the later with the polygons centroids and then we applied a “convex hull” method to calculate a new polygon. See example:

- For species with information at region or country level we applied an “interpreted distance” method to built the polygon. See example:

We applied four approaches to all butterfly species with distributional information to get an initial estimate of range size but we identify two important problems. First, using the approach (1), (3) and (4) we tended to overestimate the range size for endemic and restricted species. Second, using the approach (2) the range for species with few records (less than five) is defined by a line or for a narrow box, which is an erroneous representation of the reality. We consider two alternative approaches to undertake theses inaccuracies:
5. For species with restricted distribution (with records only from one country or locality 2,916 species), we going to define a box in the country or locality mentioned and use the coordinates to build a bounding box. Then we are going to search additional information of altitudinal interval (maximum and minimum altitude) to define the potential distribution area within the box.
6. Both approaches will need additional work to get altitudinal range, endemism information, as well as model definition.
Thus our strategy will be apply approaches (a) and (b) to all butterfly species with distributional information to generate two options of preliminary range maps.
We will implement, only for the species with restricted distribution (initially 2,916 species), an automatic search of altitudinal information in EOL text objects previously download using a similar protocol implemented for biotic association. With this information we will be able to implement the approach (3) to get a more reliable estimate of range size.
Due the approach (4) require a carefully model definition we do not consider it as option to estimate range size estimates for extensive data, this approach could be however implemented in the future, for genera or species specific analysis.


